Project > BibGraph
About BibGraph
BibGraph is a graphical tool designed to identify key authors of scientific articles retrieved with a Pubmed search.
It focuses on the first and last authors, to highlight opinion leaders and effectors within a given field (co-authorship is not supported yet)
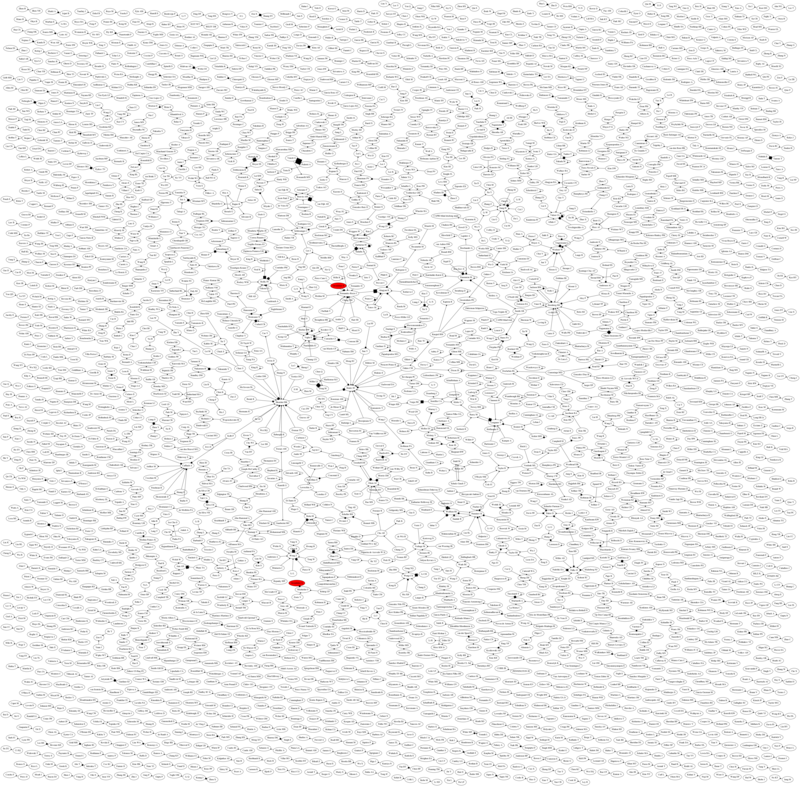
It produces a interactive image showing the connectivity between the different authors. See the example below.
From a technical standpoint, it relies on BioPython and Graphviz.
Usage
You can use it:
- online on this site - see form below
- from the command line (mail me)
Please keep in mind that if your query is pointless, the graph will be pointless
Example
The example below corresponds to the search of docking[Title] in Pubmed. The box-end of the connector identifies the last author, its size reflects the number of publications associated with the link. This graph was calculated on 2477 articles. My sister and I are colored in red.
If you click on the image to load the SVG file, or if you run your own query (see form below), you can click on authors to open a window with a list of links to their publications.
Try your own query
To go further, you need an access to our internal network :


